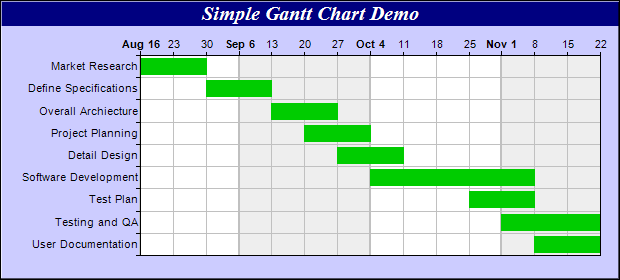
This example demonstrates a simple gantt chart.
This chart is created by using a horizontal box-whisker layer, in which only the "box" part of the box-whisker layer is used. Date/time values are used as box data, resulting in a gantt chart.
The key features demonstrated in this example are:
- Create the box-whisker layer using XYChart.addBoxWhiskerLayer, in which the data arrays are dates.
- Swap the x-axis and y-axis using XYChart.swapXY, so the chart is using a horizontal orientation.
- Use XYChart.setYAxisOnRight to move the y-axis to the opposite side of the plot area, so that the y-axis is at the top of the plot area. (Note: the "right" word on setYAxisOnRight means the "right" side before "swapXY" rotation. After rotation, the right side will become to top side.)
- Use Axis.setReverse to reverse the direction of the x-axis, so that the x-axis is vertical from top to bottom (instead of from bottom to top).
- Set the y-axis to date scale using Axis.setDateScale.
- Set multi-format axis labels for the y-axis using Axis.setMultiFormat. Note that the labels for the first week of the month are in bold, with the month name shown. The other labels just show the day.
- Use alternative background colors for the plot area by providing two background colors when calling XYChart.setPlotArea.
[File: phpdemo/gantt.php]
<?php
require_once("../lib/phpchartdir.php");

# data for the gantt chart, representing the start date, end date and names for various activities
$startDate = array(chartTime(2004, 8, 16), chartTime(2004, 8, 30), chartTime(2004, 9, 13),
    chartTime(2004, 9, 20), chartTime(2004, 9, 27), chartTime(2004, 10, 4), chartTime(2004, 10, 25),
    chartTime(2004, 11, 1), chartTime(2004, 11, 8));
$endDate = array(chartTime(2004, 8, 30), chartTime(2004, 9, 13), chartTime(2004, 9, 27), chartTime(
    2004, 10, 4), chartTime(2004, 10, 11), chartTime(2004, 11, 8), chartTime(2004, 11, 8),
    chartTime(2004, 11, 22), chartTime(2004, 11, 22));
$labels = array("Market Research", "Define Specifications", "Overall Archiecture",
    "Project Planning", "Detail Design", "Software Development", "Test Plan", "Testing and QA",
    "User Documentation");

# Create a XYChart object of size 620 x 280 pixels. Set background color to light blue (ccccff),
# with 1 pixel 3D border effect.
$c = new XYChart(620, 280, 0xccccff, 0x000000, 1);

# Add a title to the chart using 15 points Times Bold Itatic font, with white (ffffff) text on a
# deep blue (000080) background
$c->addTitle("Simple Gantt Chart Demo", "Times New Roman Bold Italic", 15, 0xffffff)->setBackground(
    0x000080);

# Set the plotarea at (140, 55) and of size 460 x 200 pixels. Use alternative white/grey background.
# Enable both horizontal and vertical grids by setting their colors to grey (c0c0c0). Set vertical
# major grid (represents month boundaries) 2 pixels in width
$c->setPlotArea(140, 55, 460, 200, 0xffffff, 0xeeeeee, LineColor, 0xc0c0c0, 0xc0c0c0)->setGridWidth(
    2, 1, 1, 1);

# swap the x and y axes to create a horziontal box-whisker chart
$c->swapXY();

# Set the y-axis scale to be date scale from Aug 16, 2004 to Nov 22, 2004, with ticks every 7 days
# (1 week)
$c->yAxis->setDateScale(chartTime(2004, 8, 16), chartTime(2004, 11, 22), 86400 * 7);

# Set multi-style axis label formatting. Month labels are in Arial Bold font in "mmm d" format.
# Weekly labels just show the day of month and use minor tick (by using '-' as first character of
# format string).
$c->yAxis->setMultiFormat(StartOfMonthFilter(), "<*font=Arial Bold*>{value|mmm d}",
    StartOfDayFilter(), "-{value|d}");

# Set the y-axis to shown on the top (right + swapXY = top)
$c->setYAxisOnRight();

# Set the labels on the x axis
$c->xAxis->setLabels($labels);

# Reverse the x-axis scale so that it points downwards.
$c->xAxis->setReverse();

# Set the horizontal ticks and grid lines to be between the bars
$c->xAxis->setTickOffset(0.5);

# Add a green (33ff33) box-whisker layer showing the box only.
$c->addBoxWhiskerLayer($startDate, $endDate, null, null, null, 0x00cc00, SameAsMainColor,
    SameAsMainColor);

# Output the chart
$viewer = new WebChartViewer("chart1");
$viewer->setChart($c, SVG);

# Include tool tip for the chart
$viewer->setImageMap($c->getHTMLImageMap("", "",
    "title='{xLabel}: {top|mmm dd, yyyy} to {bottom|mmm dd, yyyy}'"));
?>

<!DOCTYPE html>
<html>
<head>
    <title>Simple Gantt Chart</title>
    <!-- Include ChartDirector Javascript Library to support chart interactions -->
    <script type="text/javascript" src="cdjcv.js"></script>
</head>
<body style="margin:5px 0px 0px 5px">
    <div style="font:bold 18pt verdana;">
        Simple Gantt Chart
    </div>
    <hr style="border:solid 1px #000080; background:#000080" />
    <div style="font:10pt verdana; margin-bottom:1.5em">
        <a href="viewsource.php?file=<?=basename(__FILE__)?>">View Chart Source Code</a>
    </div>
    <!-- ****** Here is the chart image ****** -->
    <?php echo $viewer->renderHTML(); ?>
</body>
</html>
© 2022 Advanced Software Engineering Limited. All rights reserved.