This example demonstrates creating a box-whisker chart.
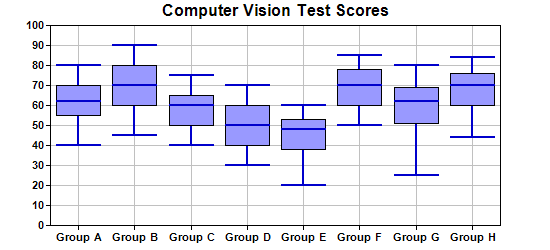
A standard box-whisker chart plots up to 5 data sets using box-whisker symbols. The 5 data sets are sometimes called the maximum, 3rd quartile, median, 1st quartile and minimum, although they can represent any kind of quantities.
In a box-whisker symbol, the 3rd and 1st quartile values are represented as a box. The maximum, minimum and median values are represented as horizontal marks. There is a vertical line joining the maximum and minimum.
In ChartDirector,
XYChart.addBoxWhiskerLayer and
XYChart.addBoxWhiskerLayer2 may be used to create single-color and multi-color box-whisker layers.
When creating a box-whisker layer, not all 5 data sets need to be present. One common usage is to provide only the 3rd and 1st quartile data (leave other arguments as empty arrays) to draw only the "box" part of the chart. This will result in a floating box chart. Another common usage is to provide only the maximum and minimum values to draw only the "whisker" part of the chart. They are useful as "error symbols". (See
Line with Error Symbols for an example.) You may even provide only the median data to draw floating mark lines.
[File: phpdemo/boxwhisker.php]
<?php
require_once("../lib/phpchartdir.php");

# Sample data for the Box-Whisker chart. Represents the minimum, 1st quartile, medium, 3rd quartile
# and maximum values of some quantities
$Q0Data = array(40, 45, 40, 30, 20, 50, 25, 44);
$Q1Data = array(55, 60, 50, 40, 38, 60, 51, 60);
$Q2Data = array(62, 70, 60, 50, 48, 70, 62, 70);
$Q3Data = array(70, 80, 65, 60, 53, 78, 69, 76);
$Q4Data = array(80, 90, 75, 70, 60, 85, 80, 84);

# The labels for the chart
$labels = array("Group A", "Group B", "Group C", "Group D", "Group E", "Group F", "Group G",
    "Group H");

# Create a XYChart object of size 550 x 250 pixels
$c = new XYChart(550, 250);

# Set the plotarea at (50, 25) and of size 450 x 200 pixels. Enable both horizontal and vertical
# grids by setting their colors to grey (0xc0c0c0)
$c->setPlotArea(50, 25, 450, 200)->setGridColor(0xc0c0c0, 0xc0c0c0);

# Add a title to the chart
$c->addTitle("Computer Vision Test Scores");

# Set the labels on the x axis and the font to Arial Bold
$c->xAxis->setLabels($labels)->setFontStyle("Arial Bold");

# Set the font for the y axis labels to Arial Bold
$c->yAxis->setLabelStyle("Arial Bold");

# Add a Box Whisker layer using light blue 0x9999ff as the fill color and blue (0xcc) as the line
# color. Set the line width to 2 pixels
$c->addBoxWhiskerLayer($Q3Data, $Q1Data, $Q4Data, $Q0Data, $Q2Data, 0x9999ff, 0x0000cc
    )->setLineWidth(2);

# Output the chart
$viewer = new WebChartViewer("chart1");
$viewer->setChart($c, SVG);

# Include tool tip for the chart
$viewer->setImageMap($c->getHTMLImageMap("", "",
    "title='{xLabel}: min/med/max = {min}/{med}/{max}\nInter-quartile range: {bottom} to {top}'"));
?>

<!DOCTYPE html>
<html>
<head>
    <title>Box-Whisker Chart (1)</title>
    <!-- Include ChartDirector Javascript Library to support chart interactions -->
    <script type="text/javascript" src="cdjcv.js"></script>
</head>
<body style="margin:5px 0px 0px 5px">
    <div style="font:bold 18pt verdana;">
        Box-Whisker Chart (1)
    </div>
    <hr style="border:solid 1px #000080; background:#000080" />
    <div style="font:10pt verdana; margin-bottom:1.5em">
        <a href="viewsource.php?file=<?=basename(__FILE__)?>">View Chart Source Code</a>
    </div>
    <!-- ****** Here is the chart image ****** -->
    <?php echo $viewer->renderHTML(); ?>
</body>
</html>
© 2022 Advanced Software Engineering Limited. All rights reserved.