<?php
require_once("../lib/phpchartdir.php");
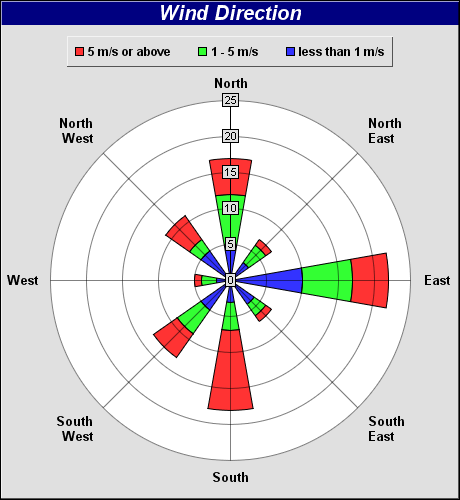
# Data for the chart
$data0 = array(5, 3, 10, 4, 3, 5, 2, 5);
$data1 = array(12, 6, 17, 6, 7, 9, 4, 7);
$data2 = array(17, 7, 22, 7, 18, 13, 5, 11);
$angles = array(0, 45, 90, 135, 180, 225, 270, 315);
$labels = array("North", "North\nEast", "East", "South\nEast", "South",
"South\nWest", "West", "North\nWest");
# Create a PolarChart object of size 460 x 500 pixels, with a grey (e0e0e0)
# background and a 1 pixel 3D border
$c = new PolarChart(460, 500, 0xe0e0e0, 0x000000, 1);
# Add a title to the chart at the top left corner using 15pts Arial Bold Italic font.
# Use white text on deep blue background.
$textBoxObj = $c->addTitle("Wind Direction", "arialbi.ttf", 15, 0xffffff);
$textBoxObj->setBackground(0x000080);
$legendBox = $c->addLegend(230, 35, false, "arialbd.ttf", 9);
$legendBox->setAlignment(TopCenter);
$legendBox->setBackground(Transparent, Transparent, 1);
$legendBox->addKey("5 m/s or above", 0xff3333);
$legendBox->addKey("1 - 5 m/s", 0x33ff33);
$legendBox->addKey("less than 1 m/s", 0x3333ff);
# Set plot area center at (230, 280) with radius 180 pixels and white background
$c->setPlotArea(230, 280, 180, 0xffffff);
# Set the grid style to circular grid
$c->setGridStyle(false);
# Set angular axis as 0 - 360, with a spoke every 30 units
$c->angularAxis->setLinearScale2(0, 360, $labels);
for($i = 0; $i < count($angles); ++$i) {
$c->angularAxis->addZone($angles[$i] - 10, $angles[$i] + 10, 0, $data0[$i],
0x3333ff, 0);
$c->angularAxis->addZone($angles[$i] - 10, $angles[$i] + 10, $data0[$i], $data1[
$i], 0x33ff33, 0);
$c->angularAxis->addZone($angles[$i] - 10, $angles[$i] + 10, $data1[$i], $data2[
$i], 0xff3333, 0);
}
# Add an Transparent invisible layer to ensure the axis is auto-scaled using the data
$c->addLineLayer($data2, Transparent);
# Output the chart
header("Content-type: image/png");
print($c->makeChart2(PNG));
?> |