<?php
require_once("../lib/phpchartdir.php");
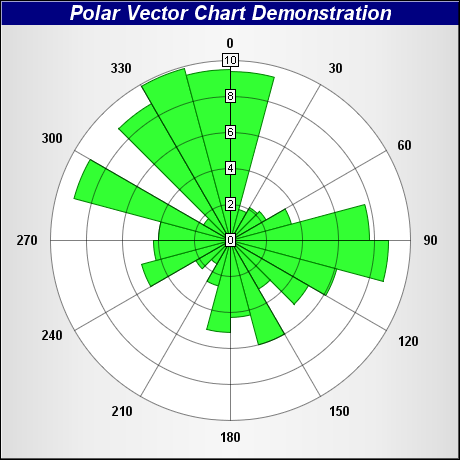
# Data for the chart
$data = array(9.4, 1.8, 2.1, 2.3, 3.5, 7.7, 8.8, 6.1, 5.0, 3.1, 6.0, 4.3, 5.1, 2.6,
1.5, 2.2, 5.1, 4.3, 4.0, 9.0, 1.7, 8.8, 9.9, 9.5);
$angles = array(0, 15, 30, 45, 60, 75, 90, 105, 120, 135, 150, 165, 180, 195, 210,
225, 240, 255, 270, 285, 300, 315, 330, 345);
# Create a PolarChart object of size 460 x 460 pixels, with a silver background and a
# 1 pixel 3D border
$c = new PolarChart(460, 460, silverColor(), 0x000000, 1);
# Add a title to the chart at the top left corner using 15pts Arial Bold Italic font.
# Use white text on deep blue background.
$textBoxObj = $c->addTitle("Polar Vector Chart Demonstration", "arialbi.ttf", 15,
0xffffff);
$textBoxObj->setBackground(0x000080);
# Set plot area center at (230, 240) with radius 180 pixels and white background
$c->setPlotArea(230, 240, 180, 0xffffff);
# Set the grid style to circular grid
$c->setGridStyle(false);
# Set angular axis as 0 - 360, with a spoke every 30 units
$c->angularAxis->setLinearScale(0, 360, 30);
# Add sectors to the chart as sector zones
for($i = 0; $i < count($data); ++$i) {
$c->angularAxis->addZone($angles[$i], $angles[$i] + 15, 0, $data[$i], 0x33ff33,
0x008000);
}
# Add an Transparent invisible layer to ensure the axis is auto-scaled using the data
$c->addLineLayer($data, Transparent);
# Output the chart
header("Content-type: image/png");
print($c->makeChart2(PNG));
?> |