


The example demonstrates various tree map layout methods configurable using TreeMapNode.setLayoutMethod.
ChartDirector 7.0 (PHP Edition)
Tree Map Layout
Source Code Listing
<?php
require_once("../lib/phpchartdir.php");
function createChart($viewer, $chartIndex)
{
# Random data for the tree map
$r = new RanSeries(3);
$data = $r->getSeries(20, 20, 400);
# Create a Tree Map object of size 300 x 300 pixels
$c = new TreeMapChart(300, 300);
$c->setPlotArea(20, 20, 260, 260);
# Obtain the root of the tree map, which is the entire plot area
$root = $c->getRootNode();
# Add first level nodes to the root.
$root->setData($data);
if ($chartIndex == 0) {
# Squarity - Layout the cells so that they are as square as possible.
$c->addTitle("Squarify");
$root->setLayoutMethod(TreeMapSquarify);
} else if ($chartIndex == 1) {
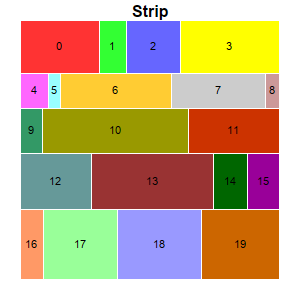
# Strip layout - Cells flow from left to right, top to bottom. The number of cells in each
# row is such that they will be as close to a square as possible. (The setLayoutMethod also
# supports other flow directions.)
$c->addTitle("Strip");
$root->setLayoutMethod(TreeMapStrip);
} else if ($chartIndex == 2) {
# Binary Split by Size - Split the cells into left/right groups so that their size are as
# close as possible. For each group, split the cells into top/bottom groups using the same
# criteria. Continue until each group contains one cell. (The setLayoutMethod also supports
# other flow directions.)
$c->addTitle("Binary Split by Size");
$root->setLayoutMethod(TreeMapBinaryBySize);
} else if ($chartIndex == 3) {
# Binary Split by Count - Same as "Binary Split by Size", except that the cell count
# (instead of the size) is used to split the cells.
$c->addTitle("Binary Split by Count");
$root->setLayoutMethod(TreeMapBinaryByCount);
} else if ($chartIndex == 4) {
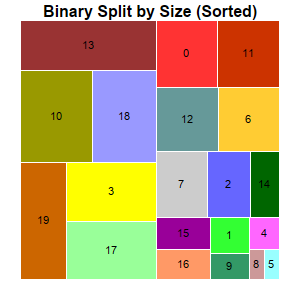
# Binary Split by Size (Sorted) - Same as "Binary Split by Size" except the cells are sorted
# first.
$c->addTitle("Binary Split by Size (Sorted)");
$root->setSorting(-1);
$root->setLayoutMethod(TreeMapBinaryBySize);
}
# Get the prototype (template) for the first level nodes.
$nodeConfig = $c->getLevelPrototype(1);
# Set the label format for the nodes to show the label and value with 8pt Arial Bold font in
# black color (000000) and center aligned in the node.
$nodeConfig->setLabelFormat("{index}", "Arial", 8, 0x000000, Center);
# Set automatic fill color and white (ffffff) border
$nodeConfig->setColors(DataColor, 0xffffff);
# Output the chart
$viewer->setChart($c, SVG);
# Include tool tip for the chart
$viewer->setImageMap($c->getHTMLImageMap("", "",
"title='<*cdml*><*b*>[{index}]<*/b*> {value|2}'"));
}
# This example includes 5 charts
$viewers = array();
for ($i = 0; $i < 5; ++$i) {
$viewers[$i] = new WebChartViewer("chart$i");
createChart($viewers[$i], $i);
}
?>
<!DOCTYPE html>
<html>
<head>
<title>Tree Map Layout</title>
<!-- Include ChartDirector Javascript Library to support chart interactions -->
<script type="text/javascript" src="cdjcv.js"></script>
</head>
<body style="margin:5px 0px 0px 5px">
<div style="font:bold 18pt verdana;">
Tree Map Layout
</div>
<hr style="border:solid 1px #000080; background:#000080" />
<div style="font:10pt verdana; margin-bottom:1.5em">
<a href="viewsource.php?file=<?=basename(__FILE__)?>">View Chart Source Code</a>
</div>
<!-- ****** Here are the chart images ****** -->
<?php
for ($i = 0; $i < count($viewers); ++$i) {
echo $viewers[$i]->renderHTML(), " ";
}
?>
</body>
</html>