This example demonstrates the basic steps in creating surface charts.
[File: phpdemo/surface.php]
<?php
require_once("../lib/phpchartdir.php");
# The x and y coordinates of the grid
$dataX = array(-10, -9, -8, -7, -6, -5, -4, -3, -2, -1, 0, 1, 2, 3, 4, 5, 6, 7, 8, 9, 10);
$dataY = array(-10, -9, -8, -7, -6, -5, -4, -3, -2, -1, 0, 1, 2, 3, 4, 5, 6, 7, 8, 9, 10);
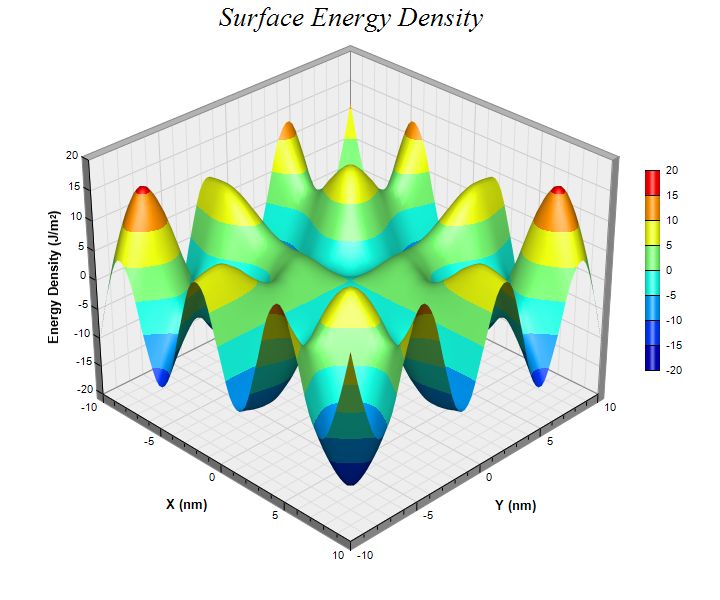
# The values at the grid points. In this example, we will compute the values using the formula z = x
# * sin(y) + y * sin(x).
$dataZ = array_fill(0, count($dataX) * count($dataY), 0);
for($yIndex = 0; $yIndex < count($dataY); ++$yIndex) {
$y = $dataY[$yIndex];
for($xIndex = 0; $xIndex < count($dataX); ++$xIndex) {
$x = $dataX[$xIndex];
$dataZ[$yIndex * count($dataX) + $xIndex] = $x * sin($y) + $y * sin($x);
}
}
# Create a SurfaceChart object of size 720 x 600 pixels
$c = new SurfaceChart(720, 600);
# Add a title to the chart using 20 points Times New Roman Italic font
$c->addTitle("Surface Energy Density ", "Times New Roman Italic", 20);
# Set the center of the plot region at (350, 280), and set width x depth x height to 360 x 360 x 270
# pixels
$c->setPlotRegion(350, 280, 360, 360, 270);
# Set the data to use to plot the chart
$c->setData($dataX, $dataY, $dataZ);
# Spline interpolate data to a 80 x 80 grid for a smooth surface
$c->setInterpolation(80, 80);
# Add a color axis (the legend) in which the left center is anchored at (645, 270). Set the length
# to 200 pixels and the labels on the right side.
$c->setColorAxis(645, 270, Left, 200, Right);
# Set the x, y and z axis titles using 10 points Arial Bold font
$c->xAxis->setTitle("X (nm)", "Arial Bold", 10);
$c->yAxis->setTitle("Y (nm)", "Arial Bold", 10);
$c->zAxis->setTitle("Energy Density (J/m<*font,super*>2<*/font*>)", "Arial Bold", 10);
# Output the chart
$viewer = new WebChartViewer("chart1");
$viewer->setChart($c, SVG);
?>
<!DOCTYPE html>
<html>
<head>
<title>Surface Chart (1)</title>
<!-- Include ChartDirector Javascript Library to support chart interactions -->
<script type="text/javascript" src="cdjcv.js"></script>
</head>
<body style="margin:5px 0px 0px 5px">
<div style="font:bold 18pt verdana;">
Surface Chart (1)
</div>
<hr style="border:solid 1px #000080; background:#000080" />
<div style="font:10pt verdana; margin-bottom:1.5em">
<a href="viewsource.php?file=<?=basename(__FILE__)?>">View Chart Source Code</a>
</div>
<!-- ****** Here is the chart image ****** -->
<?php echo $viewer->renderHTML(); ?>
</body>
</html>
© 2022 Advanced Software Engineering Limited. All rights reserved.