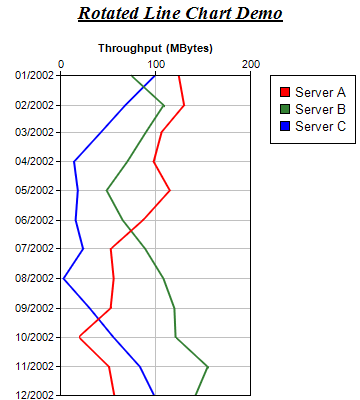
This example demonstrates swapping the x and y axes to produce a rotated line chart in which the line goes from top to bottom (instead of left to right).
The x and y axes in the example are configured as follows:
- Initially, the x-axis is horizontal from left to right at the bottom of the plot area, while the y-axis is vertical from bottom to top at the left side of the plot area.
- Swap the x and y axes using XYChart.swapXY. Now the x-axis is vertical from bottom to top at the left side of the chart, while the y-axis is horizontal from left to right at the bottom of the chart.
- Use XYChart.setYAxisOnRight to move the y-axis to the opposite side of the plot area, so that the y-axis is at the top of the plot area. (Note: the "right" word on setYAxisOnRight means the "right" side before "swapXY" rotation. After rotation, the right side will become to top side.)
- Use Axis.setReverse to reverse the direction of the x-axis, so that the x-axis is vertical from top to bottom (instead of from bottom to top).
For demo purposes, this example uses
RanTable to simulate a database table with 4 columns, in which one is a date/time column and the remaining three are data columns. The date/time column is passed to ChartDirector as the x values using
Layer.setXData, while the data columns are passed to ChartDirector as y values using
Layer.addDataSet.
[File: phpdemo/rotatedline.php]
<?php
require_once("../lib/phpchartdir.php");

#
#    We use a random table to simulate generating 12 months of data
#

# Create the random table object with 4 cols * 12 rows, using 3 as seed
$rantable = new RanTable(3, 4, 12);

# Set the 1st column to be the 12 months of year 2002
$rantable->setDateCol(0, chartTime(2002, 1, 1), 86400 * 30);

# Set the 2nd, 3rd and 4th columns to be random numbers starting from 125, 75, and 100 respectively.
# The change between rows is set to -35 to + 35. The minimum value of any cell is 0.
$rantable->setCol(1, 125, -35, 35, 0);
$rantable->setCol(2, 75, -35, 35, 0);
$rantable->setCol(3, 100, -35, 35, 0);

# Get the 1st column (time) as the x data
$dataX = $rantable->getCol(0);

# Get the 2nd, 3rd and 4th columns as 3 data sets
$dataY0 = $rantable->getCol(1);
$dataY1 = $rantable->getCol(2);
$dataY2 = $rantable->getCol(3);

# Create a XYChart object of size 360 x 400 pixels
$c = new XYChart(360, 400);

# Add a title to the chart
$c->addTitle("<*underline=2*>Rotated Line Chart Demo", "Times New Roman Bold Italic", 14);

# Set the plotarea at (60, 75) and of size 190 x 320 pixels. Turn on both horizontal and vertical
# grid lines with light grey color (0xc0c0c0)
$c->setPlotArea(60, 75, 190, 320)->setGridColor(0xc0c0c0, 0xc0c0c0);

# Add a legend box at (270, 75)
$c->addLegend(270, 75);

# Swap the x and y axis to become a rotated chart
$c->swapXY();

# Set the y axis on the top side (right + rotated = top)
$c->setYAxisOnRight();

# Add a title to the y axis
$c->yAxis->setTitle("Throughput (MBytes)");

# Reverse the x axis so it is pointing downwards
$c->xAxis->setReverse();

# Add a line chart layer using the given data
$layer = $c->addLineLayer2();
$layer->setXData($dataX);
$layer->addDataSet($dataY0, 0xff0000, "Server A");
$layer->addDataSet($dataY1, 0x338033, "Server B");
$layer->addDataSet($dataY2, 0x0000ff, "Server C");

# Set the line width to 2 pixels
$layer->setLineWidth(2);

# Output the chart
$viewer = new WebChartViewer("chart1");
$viewer->setChart($c, SVG);

# Include tool tip for the chart
$viewer->setImageMap($c->getHTMLImageMap("", "",
    "title='[{dataSetName}] {x|mm/yyyy}: {value|0} MByte'"));
?>

<!DOCTYPE html>
<html>
<head>
    <title>Rotated Line Chart</title>
    <!-- Include ChartDirector Javascript Library to support chart interactions -->
    <script type="text/javascript" src="cdjcv.js"></script>
</head>
<body style="margin:5px 0px 0px 5px">
    <div style="font:bold 18pt verdana;">
        Rotated Line Chart
    </div>
    <hr style="border:solid 1px #000080; background:#000080" />
    <div style="font:10pt verdana; margin-bottom:1.5em">
        <a href="viewsource.php?file=<?=basename(__FILE__)?>">View Chart Source Code</a>
    </div>
    <!-- ****** Here is the chart image ****** -->
    <?php echo $viewer->renderHTML(); ?>
</body>
</html>
© 2022 Advanced Software Engineering Limited. All rights reserved.