[File: phpdemo/polarvector.php]
<?php
require_once("../lib/phpchartdir.php");
# Coordinates of the starting points of the vectors
$radius = array(5, 5, 5, 5, 5, 5, 5, 5, 5, 5, 5, 5, 10, 10, 10, 10, 10, 10, 10, 10, 10, 10, 10, 10,
15, 15, 15, 15, 15, 15, 15, 15, 15, 15, 15, 15, 20, 20, 20, 20, 20, 20, 20, 20, 20, 20, 20, 20,
25, 25, 25, 25, 25, 25, 25, 25, 25, 25, 25, 25);
$angle = array(0, 30, 60, 90, 120, 150, 180, 210, 240, 270, 300, 330, 0, 30, 60, 90, 120, 150, 180,
210, 240, 270, 300, 330, 0, 30, 60, 90, 120, 150, 180, 210, 240, 270, 300, 330, 0, 30, 60, 90,
120, 150, 180, 210, 240, 270, 300, 330, 0, 30, 60, 90, 120, 150, 180, 210, 240, 270, 300, 330);
# Magnitude and direction of the vectors
$magnitude = array(5, 5, 5, 5, 5, 5, 5, 5, 5, 5, 5, 5, 4, 4, 4, 4, 4, 4, 4, 4, 4, 4, 4, 4, 3, 3, 3,
3, 3, 3, 3, 3, 3, 3, 3, 3, 2, 2, 2, 2, 2, 2, 2, 2, 2, 2, 2, 2, 1, 1, 1, 1, 1, 1, 1, 1, 1, 1, 1,
1);
$direction = array(60, 90, 120, 150, 180, 210, 240, 270, 300, 330, 0, 30, 60, 90, 120, 150, 180,
210, 240, 270, 300, 330, 0, 30, 60, 90, 120, 150, 180, 210, 240, 270, 300, 330, 0, 30, 60, 90,
120, 150, 180, 210, 240, 270, 300, 330, 0, 30, 60, 90, 120, 150, 180, 210, 240, 270, 300, 330,
0, 30);
# Create a PolarChart object of size 460 x 460 pixels
$c = new PolarChart(460, 460);
# Add a title to the chart at the top left corner using 15pt Arial Bold Italic font
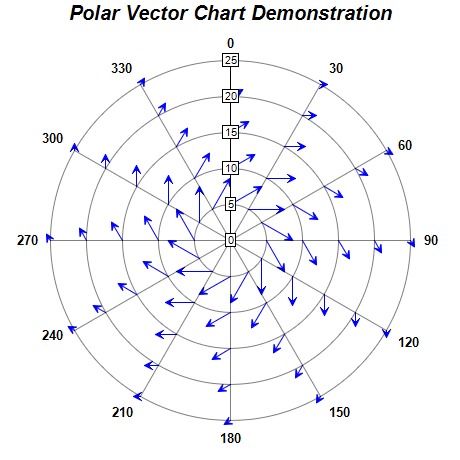
$c->addTitle("Polar Vector Chart Demonstration", "Arial Bold Italic", 15);
# Set center of plot area at (230, 240) with radius 180 pixels
$c->setPlotArea(230, 240, 180);
# Set the grid style to circular grid
$c->setGridStyle(false);
# Set angular axis as 0 - 360, with a spoke every 30 units
$c->angularAxis->setLinearScale(0, 360, 30);
# Add a polar vector layer to the chart with blue (0000ff) vectors
$c->addVectorLayer($radius, $angle, $magnitude, $direction, RadialAxisScale, 0x0000ff);
# Output the chart
$viewer = new WebChartViewer("chart1");
$viewer->setChart($c, SVG);
# Include tool tip for the chart
$viewer->setImageMap($c->getHTMLImageMap("", "",
"title='Vector at ({value}, {angle} deg): Length = {len}, Angle = {dir} deg'"));
?>
<!DOCTYPE html>
<html>
<head>
<title>Polar Vector Chart</title>
<!-- Include ChartDirector Javascript Library to support chart interactions -->
<script type="text/javascript" src="cdjcv.js"></script>
</head>
<body style="margin:5px 0px 0px 5px">
<div style="font:bold 18pt verdana;">
Polar Vector Chart
</div>
<hr style="border:solid 1px #000080; background:#000080" />
<div style="font:10pt verdana; margin-bottom:1.5em">
<a href="viewsource.php?file=<?=basename(__FILE__)?>">View Chart Source Code</a>
</div>
<!-- ****** Here is the chart image ****** -->
<?php echo $viewer->renderHTML(); ?>
</body>
</html>
© 2022 Advanced Software Engineering Limited. All rights reserved.