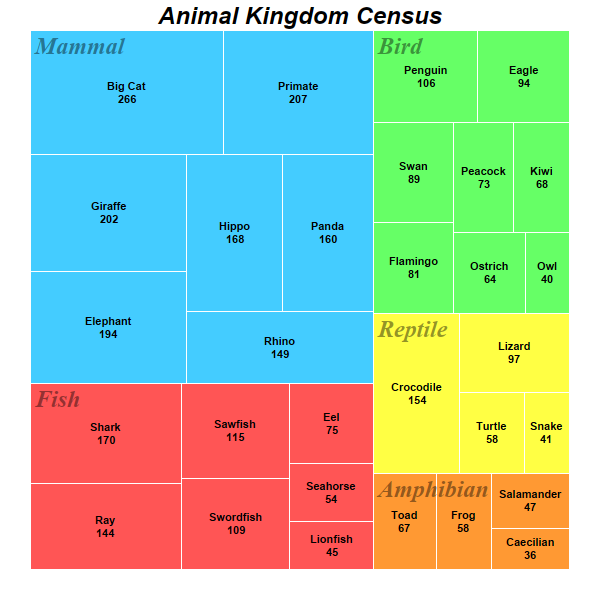
This example demonstrates a multi-level tree map.
The code in this example is similar to that of the
Simple Tree Map, with the following changes:
- Data are added to the root node with TreeMapNode.setData to produce child nodes. Data are then added to the child nodes to produce second level of child nodes.
- As there are two levels of child nodes, there are two child node prototypes, one for each level, for configuring their styles.
[File: phpdemo/multileveltreemap.php]
<?php
require_once("../lib/phpchartdir.php");

# The first level nodes of the tree map. There are 5 nodes.
$animals = array("Fish", "Amphibian", "Reptile", "Bird", "Mammal");

# In this example, the colors are based on the first level nodes.
$colors = array(0xff5555, 0xff9933, 0xffff44, 0x66ff66, 0x44ccff);

# Data for the second level nodes in "Fish"
$fish_names = array("Shark", "Ray", "Swordfish", "Sawfish", "Eel", "Lionfish", "Seahorse");
$fish_data = array(170, 144, 109, 115, 75, 45, 54);

# Data for the second level nodes in "Bird"
$bird_names = array("Swan", "Ostrich", "Eagle", "Penguin", "Kiwi", "Flamingo", "Owl", "Peacock");
$bird_data = array(89, 64, 94, 106, 68, 81, 40, 73);

# Data for the second level nodes in "Amphibian"
$amphibian_names = array("Toad", "Salamander", "Frog", "Caecilian");
$amphibian_data = array(67, 47, 58, 36);

# Data for the second level nodes in "Reptile"
$reptile_names = array("Turtle", "Crocodile", "Lizard", "Snake");
$reptile_data = array(58, 154, 97, 41);

# Data for the second level nodes in "Mammal"
$mammal_names = array("Big Cat", "Primate", "Panda", "Elephant", "Hippo", "Rhino", "Giraffe");
$mammal_data = array(266, 207, 160, 194, 168, 149, 202);

# Create a Tree Map object of size 600 x 600 pixels
$c = new TreeMapChart(600, 600);

# Add a title to the chart
$c->addTitle("Animal Kingdom Census", "Arial Bold Italic", 18);

# Set the plotarea at (30, 30) and of size 540 x 540 pixels
$c->setPlotArea(30, 30, 540, 540);

# Obtain the root of the tree map, which is the entire plot area
$root = $c->getRootNode();

# Add first level nodes to the root. We do not need to provide data as they will be computed as the
# sum of the second level nodes.
$root->setData(null, $animals, $colors);

# Add second level nodes to each of the first level node
$root->getNode(0)->setData($fish_data, $fish_names);
$root->getNode(1)->setData($amphibian_data, $amphibian_names);
$root->getNode(2)->setData($reptile_data, $reptile_names);
$root->getNode(3)->setData($bird_data, $bird_names);
$root->getNode(4)->setData($mammal_data, $mammal_names);

# Get the prototype (template) for the first level nodes.
$nodeConfig = $c->getLevelPrototype(1);

# Set the label format for the nodes to show the label with 8pt Arial Bold font in semi-transparent
# black color (0x77000000). Put the text at the top left corner of the cell.
$nodeConfig->setLabelFormat("{label}", "Times New Roman Bold Italic", 18, 0x77000000, TopLeft);

# Set the border color to white (ffffff)
$nodeConfig->setColors(-1, 0xffffff);

# Get the prototype (template) for the second level nodes.
$nodeConfig2 = $c->getLevelPrototype(2);

# Set the label format for the nodes to show the label and value with 8pt Arial Bold font. Put the
# text at the center of the cell.
$nodeConfig2->setLabelFormat("{label}<*br*>{value}", "Arial Bold", 8, TextColor, Center);

# Set the border color to white (ffffff)
$nodeConfig2->setColors(-1, 0xffffff);

# Output the chart
$viewer = new WebChartViewer("chart1");
$viewer->setChart($c, SVG);

# Include tool tip for the chart
$viewer->setImageMap($c->getHTMLImageMap("", "", "title='<*cdml*>{label}: {value}'"));
?>

<!DOCTYPE html>
<html>
<head>
    <title>Multi Level Tree Map</title>
    <!-- Include ChartDirector Javascript Library to support chart interactions -->
    <script type="text/javascript" src="cdjcv.js"></script>
</head>
<body style="margin:5px 0px 0px 5px">
    <div style="font:bold 18pt verdana;">
        Multi Level Tree Map
    </div>
    <hr style="border:solid 1px #000080; background:#000080" />
    <div style="font:10pt verdana; margin-bottom:1.5em">
        <a href="viewsource.php?file=<?=basename(__FILE__)?>">View Chart Source Code</a>
    </div>
    <!-- ****** Here is the chart image ****** -->
    <?php echo $viewer->renderHTML(); ?>
</body>
</html>
© 2022 Advanced Software Engineering Limited. All rights reserved.