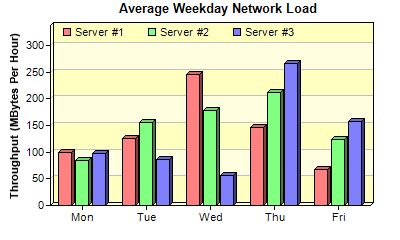
This example demonstrates a multi-bar chart, in which bars are clustered. It also demonstrates using alternative plot area background colors, and putting legends internal to the plot area.
A multi-bar chart is a bar chart in which multiple data sets are represented by drawing the bars side by side in a cluster. The multi-bar layer is created by using
XYChart.addBarLayer2 with the
Side predefined constant.
In this example, the two alternative background colors in the plot area is achieved by specifying two background colors in
PlotArea.setBackground. ChartDirector also supports another method
PlotArea.setAltBgColor that can be used for both horizontal and vertical alternative background colors.
Note that in this example, a margin is configured at the top of the plot area for the legend keys. This is achieved by using
Axis.setMargin.
[File: phpdemo/multibar.php]
<?php
require_once("../lib/phpchartdir.php");

# The data for the bar chart
$data0 = array(100, 125, 245, 147, 67);
$data1 = array(85, 156, 179, 211, 123);
$data2 = array(97, 87, 56, 267, 157);
$labels = array("Mon", "Tue", "Wed", "Thu", "Fri");

# Create a XYChart object of size 400 x 240 pixels
$c = new XYChart(400, 240);

# Add a title to the chart using 10 pt Arial font
$c->addTitle("         Average Weekday Network Load", "", 10);

# Set the plot area at (50, 25) and of size 320 x 180. Use two alternative background colors
# (0xffffc0 and 0xffffe0)
$c->setPlotArea(50, 25, 320, 180, 0xffffc0, 0xffffe0);

# Add a legend box at (55, 18) using horizontal layout. Use 8 pt Arial font, with transparent
# background
$c->addLegend(55, 18, false, "", 8)->setBackground(Transparent);

# Add a title to the y-axis
$c->yAxis->setTitle("Throughput (MBytes Per Hour)");

# Reserve 20 pixels at the top of the y-axis for the legend box
$c->yAxis->setTopMargin(20);

# Set the x axis labels
$c->xAxis->setLabels($labels);

# Add a multi-bar layer with 3 data sets and 3 pixels 3D depth
$layer = $c->addBarLayer2(Side, 3);
$layer->addDataSet($data0, 0xff8080, "Server #1");
$layer->addDataSet($data1, 0x80ff80, "Server #2");
$layer->addDataSet($data2, 0x8080ff, "Server #3");

# Output the chart
$viewer = new WebChartViewer("chart1");
$viewer->setChart($c, SVG);

# Include tool tip for the chart
$viewer->setImageMap($c->getHTMLImageMap("", "",
    "title='{dataSetName} on {xLabel}: {value} MBytes/hour'"));
?>

<!DOCTYPE html>
<html>
<head>
    <title>Multi-Bar Chart</title>
    <!-- Include ChartDirector Javascript Library to support chart interactions -->
    <script type="text/javascript" src="cdjcv.js"></script>
</head>
<body style="margin:5px 0px 0px 5px">
    <div style="font:bold 18pt verdana;">
        Multi-Bar Chart
    </div>
    <hr style="border:solid 1px #000080; background:#000080" />
    <div style="font:10pt verdana; margin-bottom:1.5em">
        <a href="viewsource.php?file=<?=basename(__FILE__)?>">View Chart Source Code</a>
    </div>
    <!-- ****** Here is the chart image ****** -->
    <?php echo $viewer->renderHTML(); ?>
</body>
</html>
© 2022 Advanced Software Engineering Limited. All rights reserved.