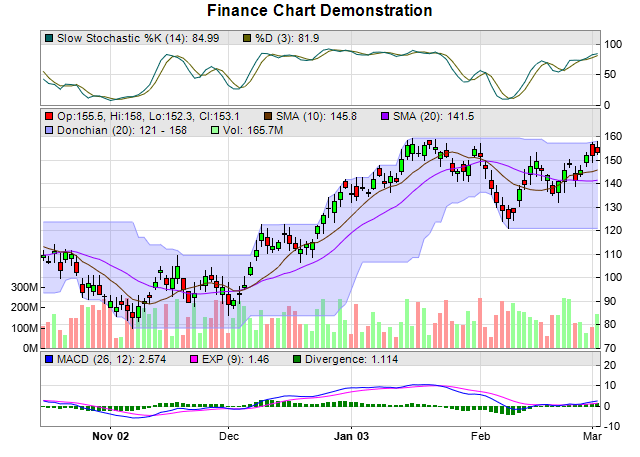
This example demonstrate creating a full-featured finance chart, with candlesticks, moving averages, Donchian channel, volume bars, MACD and Stochastic indicators.
This example employs the
FinanceChart library add-on to allow complex financial charts to be composed easily. In this example, the key steps are:
For simplicity and to allow this example to run without connecting to a real database, a
RanTable object is used to simulate the data.
RanTable is a ChartDirector utility class used for creating tables with random numbers.
[File: phpdemo/finance2.php]
<?php
require_once("../lib/FinanceChart.php");

# Create a finance chart demo containing 100 days of data
$noOfDays = 100;

# To compute moving averages starting from the first day, we need to get extra data points before
# the first day
$extraDays = 30;

# In this exammple, we use a random number generator utility to simulate the data. We set up the
# random table to create 6 cols x (noOfDays + extraDays) rows, using 9 as the seed.
$rantable = new RanTable(9, 6, $noOfDays + $extraDays);

# Set the 1st col to be the timeStamp, starting from Sep 4, 2002, with each row representing one
# day, and counting week days only (jump over Sat and Sun)
$rantable->setDateCol(0, chartTime(2002, 9, 4), 86400, true);

# Set the 2nd, 3rd, 4th and 5th columns to be high, low, open and close data. The open value starts
# from 100, and the daily change is random from -5 to 5.
$rantable->setHLOCCols(1, 100, -5, 5);

# Set the 6th column as the vol data from 5 to 25 million
$rantable->setCol(5, 50000000, 250000000);

# Now we read the data from the table into arrays
$timeStamps = $rantable->getCol(0);
$highData = $rantable->getCol(1);
$lowData = $rantable->getCol(2);
$openData = $rantable->getCol(3);
$closeData = $rantable->getCol(4);
$volData = $rantable->getCol(5);

# Create a FinanceChart object of width 640 pixels
$c = new FinanceChart(640);

# Add a title to the chart
$c->addTitle("Finance Chart Demonstration");

# Set the data into the finance chart object
$c->setData($timeStamps, $highData, $lowData, $openData, $closeData, $volData, $extraDays);

# Add a slow stochastic chart (75 pixels high) with %K = 14 and %D = 3
$c->addSlowStochastic(75, 14, 3, 0x006060, 0x606000);

# Add the main chart with 240 pixels in height
$c->addMainChart(240);

# Add a 10 period simple moving average to the main chart, using brown color
$c->addSimpleMovingAvg(10, 0x663300);

# Add a 20 period simple moving average to the main chart, using purple color
$c->addSimpleMovingAvg(20, 0x9900ff);

# Add candlestick symbols to the main chart, using green/red for up/down days
$c->addCandleStick(0x00ff00, 0xff0000);

# Add 20 days donchian channel to the main chart, using light blue (9999ff) as the border and
# semi-transparent blue (c06666ff) as the fill color
$c->addDonchianChannel(20, 0x9999ff, 0xc06666ff);

# Add a 75 pixels volume bars sub-chart to the bottom of the main chart, using green/red/grey for
# up/down/flat days
$c->addVolBars(75, 0x99ff99, 0xff9999, 0x808080);

# Append a MACD(26, 12) indicator chart (75 pixels high) after the main chart, using 9 days for
# computing divergence.
$c->addMACD(75, 26, 12, 9, 0x0000ff, 0xff00ff, 0x008000);

# Output the chart
$viewer = new WebChartViewer("chart1");
$viewer->setChart($c, SVG);
?>

<!DOCTYPE html>
<html>
<head>
    <title>Finance Chart (2)</title>
    <!-- Include ChartDirector Javascript Library to support chart interactions -->
    <script type="text/javascript" src="cdjcv.js"></script>
</head>
<body style="margin:5px 0px 0px 5px">
    <div style="font:bold 18pt verdana;">
        Finance Chart (2)
    </div>
    <hr style="border:solid 1px #000080; background:#000080" />
    <div style="font:10pt verdana; margin-bottom:1.5em">
        <a href="viewsource.php?file=<?=basename(__FILE__)?>">View Chart Source Code</a>
    </div>
    <!-- ****** Here is the chart image ****** -->
    <?php echo $viewer->renderHTML(); ?>
</body>
</html>
© 2022 Advanced Software Engineering Limited. All rights reserved.