<?php
require_once("../lib/phpchartdir.php");
# The data for the pyramid chart
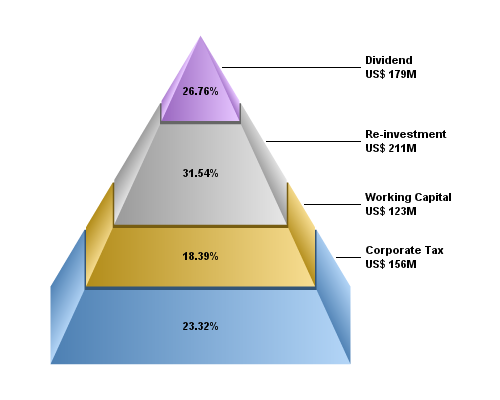
$data = array(156, 123, 211, 179);
# The labels for the pyramid chart
$labels = array("Corporate Tax", "Working Capital", "Re-investment", "Dividend");
# The colors for the pyramid layers
$colors = array(0x66aaee, 0xeebb22, 0xcccccc, 0xcc88ff);
# Create a PyramidChart object of size 500 x 400 pixels
$c = new PyramidChart(500, 400);
# Set the pyramid center at (200, 180), and width x height to 150 x 300 pixels
$c->setPyramidSize(200, 180, 150, 300);
# Set the elevation to 15 degrees
$c->setViewAngle(15);
# Set the pyramid data and labels
$c->setData($data, $labels);
# Set the layer colors to the given colors
$c->setColors2(DataColor, $colors);
# Leave 1% gaps between layers
$c->setLayerGap(0.01);
# Add labels at the center of the pyramid layers using Arial Bold font. The labels
# will show the percentage of the layers.
$c->setCenterLabel("{percent}%", "arialbd.ttf");
# Add labels at the right side of the pyramid layers using Arial Bold font. The
# labels will have two lines showing the layer name and value.
$c->setRightLabel("{label}\nUS\$ {value}M", "arialbd.ttf");
# Output the chart
header("Content-type: image/png");
print($c->makeChart2(PNG));
?> |