<?php
require_once("../lib/phpchartdir.php");
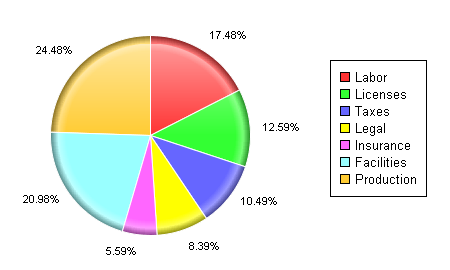
# The data for the pie chart
$data = array(25, 18, 15, 12, 8, 30, 35);
# The labels for the pie chart
$labels = array("Labor", "Licenses", "Taxes", "Legal", "Insurance", "Facilities",
"Production");
# Create a PieChart object of size 450 x 270 pixels
$c = new PieChart(450, 270);
# Set the center of the pie at (150, 100) and the radius to 80 pixels
$c->setPieSize(150, 135, 100);
# add a legend box where the top left corner is at (330, 50)
$c->addLegend(330, 60);
# modify the sector label format to show percentages only
$c->setLabelFormat("{percent}%");
# Set the pie data and the pie labels
$c->setData($data, $labels);
# Use rounded edge shading, with a 1 pixel white (FFFFFF) border
$c->setSectorStyle(RoundedEdgeShading, 0xffffff, 1);
# Output the chart
header("Content-type: image/png");
print($c->makeChart2(PNG));
?> |