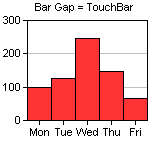
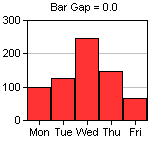
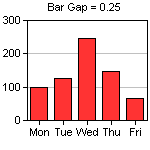
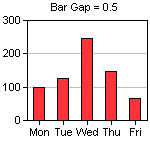
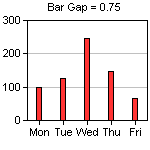
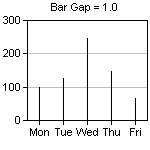
This example demonstrates the effects of different bar gaps configured using BarLayer.setBarGap.
ChartDirector Ver 5.0 (PHP Edition)
Bar Gap
Source Code Listing
<?php
require_once("../lib/phpchartdir.php");

$bargap = (int)($_REQUEST["img"]) * 0.25 - 0.25;

# The data for the bar chart
$data = array(100, 125, 245, 147, 67);

# The labels for the bar chart
$labels = array("Mon", "Tue", "Wed", "Thu", "Fri");

# Create a XYChart object of size 150 x 150 pixels
$c = new XYChart(150, 150);

# Set the plotarea at (27, 20) and of size 120 x 100 pixels
$c->setPlotArea(27, 20, 120, 100);

# Set the labels on the x axis
$c->xAxis->setLabels($labels);

if ($bargap >= 0) {
    # Add a title to display to bar gap using 8 pts Arial font
    $c->addTitle("      Bar Gap = $bargap", "arial.ttf", 8);
} else {
    # Use negative value to mean TouchBar
    $c->addTitle("      Bar Gap = TouchBar", "arial.ttf", 8);
    $bargap = TouchBar;
}

# Add a bar chart layer using the given data and set the bar gap
$barLayerObj = $c->addBarLayer($data);
$barLayerObj->setBarGap($bargap);

# Output the chart
header("Content-type: image/png");
print($c->makeChart2(PNG));
?> |