In this example, a clickable line chart will be created with legend keys, a title box, a vertical mark with label, and a custom text box. All these objects will be clickable in addition to the lines and the data points.
This example also demonstrate how to use client side Javascript as the click handler.
The code for this example is listed below.
[File: phpdemo/customclick.php]
<?php
require_once("../lib/phpchartdir.php");
# The data for the line chart
$data0 = array(50, 55, 47, 36, 42, 49, 63, 62, 73, 59, 56, 50, 64, 60, 67, 67, 58,
59, 73, 77, 84, 82, 80, 84);
$data1 = array(36, 28, 25, 33, 38, 20, 22, 30, 25, 33, 30, 24, 28, 36, 30, 45, 46,
42, 48, 45, 43, 52, 64, 70);
# The labels for the line chart
$labels = array("Jan-04", "Feb-04", "Mar-04", "Apr-04", "May-04", "Jun-04", "Jul-04",
"Aug-04", "Sep-04", "Oct-04", "Nov-04", "Dec-04", "Jan-05", "Feb-05", "Mar-05",
"Apr-05", "May-05", "Jun-05", "Jul-05", "Aug-05", "Sep-05", "Oct-05", "Nov-05",
"Dec-05");
# Create an XYChart object of size 600 x 360 pixels, with a light blue (EEEEFF)
# background, black border, 1 pxiel 3D border effect and rounded corners
$c = new XYChart(600, 360, 0xeeeeff, 0x000000, 1);
$c->setRoundedFrame();
# Set plotarea at (55, 60) with size of 520 x 240 pixels. Use white (ffffff) as
# background and grey (cccccc) for grid lines
$c->setPlotArea(55, 60, 520, 240, 0xffffff, -1, -1, 0xcccccc, 0xcccccc);
# Add a legend box at (55, 58) (top of plot area) using 9 pts Arial Bold font with
# horizontal layout Set border and background colors of the legend box to Transparent
$legendBox = $c->addLegend(55, 58, false, "arialbd.ttf", 9);
$legendBox->setBackground(Transparent);
# Reserve 10% margin at the top of the plot area during auto-scaling to leave space
# for the legends.
$c->yAxis->setAutoScale(0.1);
# Add a title to the chart using 15 pts Times Bold Italic font. The text is white
# (ffffff) on a blue (0000cc) background, with glass effect.
$title = $c->addTitle("Monthly Revenue for Year 2000/2001", "timesbi.ttf", 15,
0xffffff);
$title->setBackground(0x0000cc, 0x000000, glassEffect(ReducedGlare));
# Add a title to the y axis
$c->yAxis->setTitle("Month Revenue (USD millions)");
# Set the labels on the x axis. Draw the labels vertical (angle = 90)
$labelsObj = $c->xAxis->setLabels($labels);
$labelsObj->setFontAngle(90);
# Add a vertical mark at x = 17 using a semi-transparent purple (809933ff) color and
# Arial Bold font. Attached the mark (and therefore its label) to the top x axis.
$mark = $c->xAxis2->addMark(17, 0x809933ff, "Merge with Star Tech", "arialbd.ttf");
# Set the mark line width to 2 pixels
$mark->setLineWidth(2);
# Set the mark label font color to purple (0x9933ff)
$mark->setFontColor(0x9933ff);
# Add a copyright message at (575, 295) (bottom right of plot area) using Arial Bold
# font
$copyRight = $c->addText(575, 295, "(c) Copyright Space Travel Ltd", "arialbd.ttf");
$copyRight->setAlignment(BottomRight);
# Add a line layer to the chart
$layer = $c->addLineLayer();
# Set the default line width to 3 pixels
$layer->setLineWidth(3);
# Add the data sets to the line layer
$layer->addDataSet($data0, -1, "Enterprise");
$layer->addDataSet($data1, -1, "Consumer");
# Create the image
$chart1URL = $c->makeSession("chart1");
# Create an image map for the chart
$chartImageMap = $c->getHTMLImageMap("xystub.php", "",
"title='{dataSetName} @ {xLabel} = USD {value|0} millions'");
# Create an image map for the legend box
$legendImageMap = $legendBox->getHTMLImageMap(
"javascript:popMsg('the legend key [{dataSetName}]');", " ",
"title='This legend key is clickable!'");
# Obtain the image map coordinates for the title, mark, and copyright message. These
# will be used to define the image map inline. (See HTML code below.)
$titleCoor = $title->getImageCoor();
$markCoor = $mark->getImageCoor();
$copyRightCoor = $copyRight->getImageCoor();
?>
<html>
<body style="margin:5px 0px 0px 5px">
<script type="text/javascript">
function popMsg(msg) {
alert("You have clicked on " + msg + ".");
}
</script>
<div style="font-size:18pt; font-family:verdana; font-weight:bold">
Custom Clickable Objects
</div>
<hr style="border:solid 1px #000080" />
<div style="font-size:10pt; font-family:verdana; margin-bottom:20px">
<a href='viewsource.php?file=<?php echo $_SERVER["SCRIPT_NAME"]?>'>View Source Code</a>
</div>
<div style="font-size:10pt; font-family:verdana; width:600px; margin-bottom:20px">
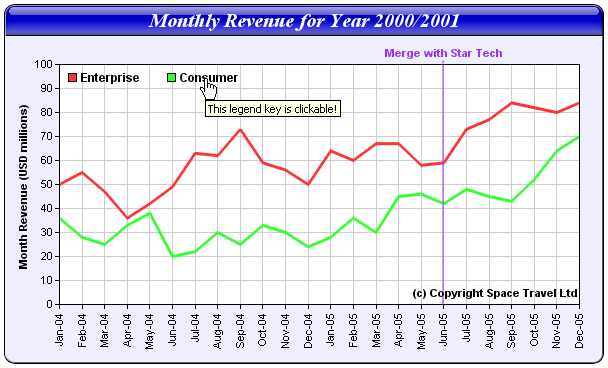
In the following chart, the lines, legend keys, title, copyright, and the "Merge
with Star Tech" text are all clickable!
</div>
<img src="getchart.php?<?php echo $chart1URL?>" border="0" usemap="#map1">
<map name="map1">
<?php echo $chartImageMap?>
<?php echo $legendImageMap?>
<area <?php echo $titleCoor?> href='javascript:popMsg("the chart title");'
title='The title is clickable!' />
<area <?php echo $markCoor?> href='javascript:popMsg("the Merge with Star Tech mark");'
title='The "Merge with Star Tech" text is clickable!' />
<area <?php echo $copyRightCoor?> href='javascript:popMsg("the copyright message");'
title='The copyright text is clickable!' />
</map>
</body>
</html> |
In the above code, the chart is created and saved in a session variable using BaseChart.makeSession. An <IMG> tag is used to retrieve the chart with "getchart.php?<?php echo $chart1URL?>" as the URL. "getchart.php" is a simple utility that comes with ChartDirector for retrieving images from session variables.
NOTE: This sample script uses "getchart.php" and assumes it is in the same directory as the script. When developing your own script using this sample script as a template, please ensure you copy "getchart.php" to the same directory as your script. If you put "getchart.php" in other directory, please adjust the paths in your script accordingly.
The image map in this example consists of multiple parts. The part for the line chart is produced using BaseChart.getHTMLImageMap with "xystub.php" as the handler:
$chartImageMap = $c->getHTMLImageMap("xystub.php", "",
    "title='{dataSetName} @ {xLabel} = USD {value|0} millions'");
For demo purpose, "xystub.php" simply displays information on what is clicked. It's source code is as follows.
[File: phpdemo/xystub.php]
<html>
<body style="margin:5px 0px 0px 5px">
<div style="font-size:18pt; font-family:verdana; font-weight:bold">
    Simple Clickable XY Chart Handler
</div>
<hr style="border:solid 1px #000080" />
<div style="font-size:10pt; font-family:verdana; margin-bottom:20">
    <a href="viewsource.php?file=<?php echo $_SERVER["SCRIPT_NAME"]?>">View Source Code</a>
</div>
<div style="font-size:10pt; font-family:verdana;">
<b>You have clicked on the following chart element :</b><br />
<ul>
    <li>Data Set : <?php echo $_REQUEST["dataSetName"]?></li>
    <li>X Position : <?php echo $_REQUEST["x"]?></li>
    <li>X Label : <?php echo $_REQUEST["xLabel"]?></li>
    <li>Data Value : <?php echo $_REQUEST["value"]?></li>
</ul>
</div>
</body>
</html> |
The image map for the legend keys is produced using LegendBox.getHTMLImageMap. In this example, a client side Javascript will be executed when the user clicks on the legend key.
$legendImageMap = $legendBox->getHTMLImageMap(
    "javascript:popMsg('the legend key [{dataSetName}]');", " ",
    "title='This legend key is clickable!'");
As shown above, the "javascript:popMsg(...);" as used in the url parameter of "getHTMLImageMap". The browser will interpret it as a client side Javascript statement to be executed when the <AREA> tag is clicked.
Note that the second argument to LegendBox.getHTMLImageMap is set to a space character. This argument specifies the HTTP query parameters to be append to the url. In this example, since the url is actually a client side Javascript, no query parameter is necessary. So a space character is used. (We cannot use an empty string, as it means the default query parameters will be used.)
The client side Javascript executed in this example just pops up a message.
<SCRIPT>
function popMsg(msg) {
    alert("You have clicked on " + msg + ".");
}
</SCRIPT>
Most text messages in ChartDirector are represented as TextBox objects, and their image map coordinates can be retrieved using Box.getImageCoor. This allows <AREA> tags for TextBox objects be created easily.
(For TextBox, there is no "getHTMLImageMap" method. It is because each TextBox object only has one hot spot. It is more convenient to enter the handler URL and tool tip text directly into the <AREA> tag, rather than generating them using getHTMLImageMap.)
In this example, the image map coordinates of the chart title, vertical mark label, and the copyright message are obtained using Box.getImageCoor:
$titleCoor = $title->getImageCoor();
$markCoor = $mark->getImageCoor();
$copyRightCoor = $copyRight->getImageCoor();
The image map coordinates are then used to make <AREA> tags as follows:
<area <?php echo $titleCoor?>  href='javascript:popMsg("the chart title");'
    title='The title is clickable!'>
<area <?php echo $markCoor?> href='javascript:popMsg("the Merge with Star Tech mark");'
    title='The "Merge with Star Tech" text is clickable!'>
<area <?php echo $copyRightCoor?> href='javascript:popMsg("the copyright message");'
    title='The copyright text is clickable!'>