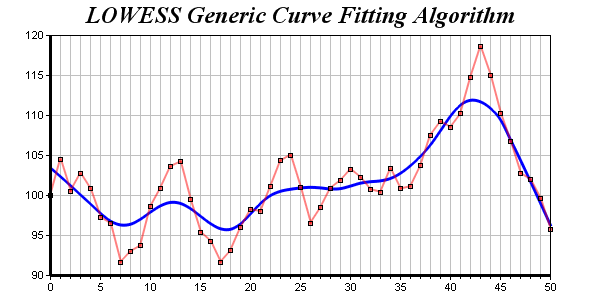
This example demonstrates the LOWESS general purpose curve fitting that is built into ChartDirector.
In regression curve fitting, a function type have to be chosen first, and the data are used to compute the best parameters of that function. For example, in polynomial regression, the function type is a polynomial of a given degree, and the data are used to determine the optimal polynomial coefficients.
However, in many applications, the function type is not known or not expressible in algebraic form. To handle these cases, ChartDirector supports a general curve fitting algorithm known as LOWESS. For details, please refer to ArrayMath.lowess and ArrayMath.lowess2.
The LOWESS algorithm only adjusts the points to smoothen them. They still need to be joined together. In this example, the adjusted points are joined with a spline layer using XYChart.addSplineLayer.