<?php
require_once("../lib/phpchartdir.php");
# The x and y coordinates of the grid
$dataX = array(-4, -3, -2, -1, 0, 1, 2, 3, 4);
$dataY = array(-4, -3, -2, -1, 0, 1, 2, 3, 4);
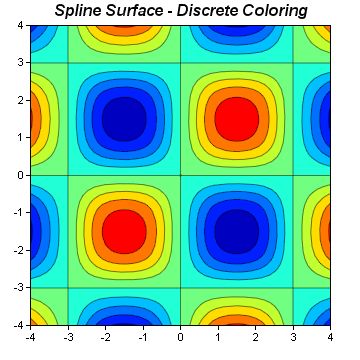
# The values at the grid points. In this example, we will compute the values using
# the formula z = Sin(x * pi / 3) * Sin(y * pi / 3).
$dataZ = array_pad(array(), count($dataX) * count($dataY), 0);
for($yIndex = 0; $yIndex < count($dataY); ++$yIndex) {
$y = $dataY[$yIndex];
for($xIndex = 0; $xIndex < count($dataX); ++$xIndex) {
$x = $dataX[$xIndex];
$dataZ[$yIndex * count($dataX) + $xIndex] = sin($x * 3.1416 / 3) * sin($y *
3.1416 / 3);
}
}
# Create a XYChart object of size 360 x 360 pixels
$c = new XYChart(360, 360);
# Set the plotarea at (30, 25) and of size 300 x 300 pixels. Use semi-transparent
# black (c0000000) for both horizontal and vertical grid lines
$c->setPlotArea(30, 25, 300, 300, -1, -1, -1, 0xc0000000, -1);
# Add a contour layer using the given data
$layer = $c->addContourLayer($dataX, $dataY, $dataZ);
# Set the x-axis and y-axis scale
$c->xAxis->setLinearScale(-4, 4, 1);
$c->yAxis->setLinearScale(-4, 4, 1);
if ($_REQUEST["img"] == "0") {
# Discrete coloring, spline surface interpolation
$c->addTitle("Spline Surface - Discrete Coloring", "arialbi.ttf", 12);
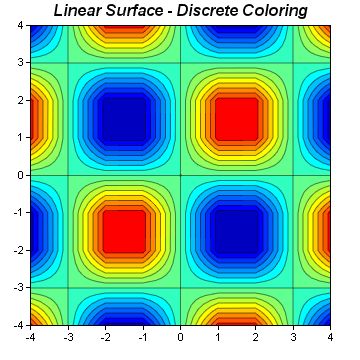
} else if ($_REQUEST["img"] == "1") {
# Discrete coloring, linear surface interpolation
$c->addTitle("Linear Surface - Discrete Coloring", "arialbi.ttf", 12);
$layer->setSmoothInterpolation(false);
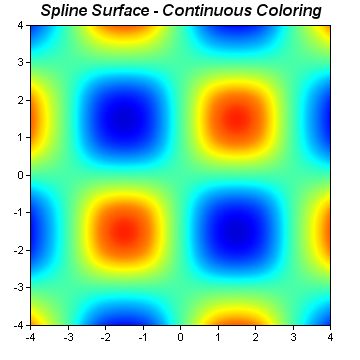
} else if ($_REQUEST["img"] == "2") {
# Smooth coloring, spline surface interpolation
$c->addTitle("Spline Surface - Continuous Coloring", "arialbi.ttf", 12);
$layer->setContourColor(Transparent);
$layer->colorAxis->setColorGradient(true);
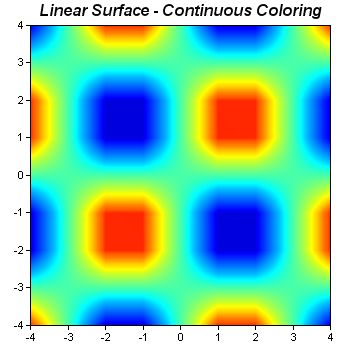
} else {
# Discrete coloring, linear surface interpolation
$c->addTitle("Linear Surface - Continuous Coloring", "arialbi.ttf", 12);
$layer->setSmoothInterpolation(false);
$layer->setContourColor(Transparent);
$layer->colorAxis->setColorGradient(true);
}
# Output the chart
header("Content-type: image/jpeg");
print($c->makeChart2(JPG));
?> |