This example demonstrates using PyramidChart.setConeSize to specify using a cone instead of a pyramid to represent the data.
ChartDirector Ver 5.0 (PHP Edition)
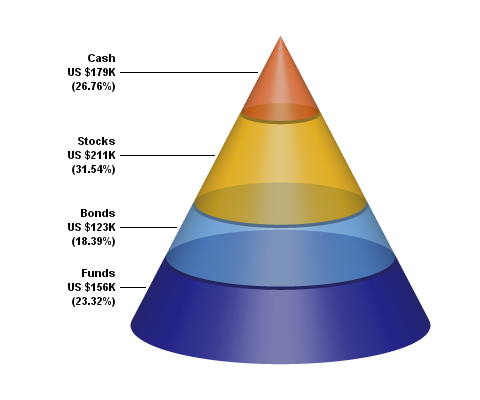
Cone Chart
Source Code Listing
<?php
require_once("../lib/phpchartdir.php");

# The data for the pyramid chart
$data = array(156, 123, 211, 179);

# The labels for the pyramid chart
$labels = array("Funds", "Bonds", "Stocks", "Cash");

# The semi-transparent colors for the pyramid layers
$colors = array(0x60000088, 0x6066aaee, 0x60ffbb00, 0x60ee6622);

# Create a PyramidChart object of size 480 x 400 pixels
$c = new PyramidChart(480, 400);

# Set the cone center at (280, 180), and width x height to 150 x 300 pixels
$c->setConeSize(280, 180, 150, 300);

# Set the elevation to 15 degrees
$c->setViewAngle(15);

# Set the pyramid data and labels
$c->setData($data, $labels);

# Set the layer colors to the given colors
$c->setColors2(DataColor, $colors);

# Leave 1% gaps between layers
$c->setLayerGap(0.01);

# Add labels at the left side of the pyramid layers using Arial Bold font. The labels
# will have 3 lines showing the layer name, value and percentage.
$c->setLeftLabel("{label}\nUS \${value}K\n({percent}%)", "arialbd.ttf");

# Output the chart
header("Content-type: image/png");
print($c->makeChart2(PNG));
?> |